Clean water is vital for ecosystems and the economy. The National Institute of Water and Atmospheric Science (NIWA), regional councils and other agencies regularly monitor streams and rivers to assess water quality.
NIWA operates the National River Water Quality Network. It monitors 77 sites on 35 rivers in the North and South Islands. Monitoring began in 1989, and the data provides a national perspective on the state of New Zealand’s water quality.
Waikato Regional Council (WRC) measures water quality every month at 100 river and stream sites in the region, including five sites on the Waipā River and 10 sites on the Waikato River. WRC also surveys the stream habitat of 125 river and stream sites to assess their suitability for the plants, insects, fish and other animals that live there.
An ongoing action
Tangata whenua and early settlers had their own ways of monitoring the environment in which they lived. They noted and understood seasonal and yearly patterns and the various indicators of impacts that dictated changes in tikanga and practices. Mātauranga Māori is a valued component of understanding Aotearoa New Zealand’s changing environment, and several cultural indicators are currently incorporated alongside contemporary science.
Factors affecting water quality
The surveys test the water for ecological health (the ability of the waterway to support plants and animals) and the suitability for human use such as swimming and general water supply.
Many factors affect water quality, including:
- the geology of a stream – what the bottom or substrate of the stream is formed from
- the surrounding land cover, soil types and activities carried out on the land
- topography – the steepness of surrounding land
- the source – how much it is fed by overland flow or by water from springs and wetlands
- flow – affected by rainfall, catchment vegetation and soil and by water that is removed
- inputs such as run-off from the land, stormwater or discharges from industry
- the plants and animals that live in the stream and can change conditions within it – for example, introduced koi carp stir up sediment on the bed, making water muddy.
Water quality indicators
There are several physical factors that are used to measure water quality. One factor that affects both ecological health and recreation is water clarity (turbidity) – how clear or cloudy the water is. Water clarity is affected by:
- sediment – small particles of soil washed into rivers, usually from erosion
- algae that occur naturally in streams but grow quickly in water that is enriched with agricultural nutrients
- where there is slow flow – for example, as a result of hydro dams.
Surveys also look at biological factors. Aquatic macroinvertebrates are insects, snails, worms and crustaceans that live in water. Because some have a higher tolerance than others to pollution, invertebrates can be used to indicate the health of a waterway. In general, mayfly, stonefly and caddisfly larvae are all associated with streams that have a high-quality habitat – for example, the headwaters of a cool, forested stream with a rocky bottom. Snails, fly larvae and worms are found in more polluted, muddier and warmer streams, usually in the lower part of a catchment and often associated with urban areas or agricultural development. Learn more about water quality indicators in the article Water quality monitoring and in the video below.
Identifying pollution sources
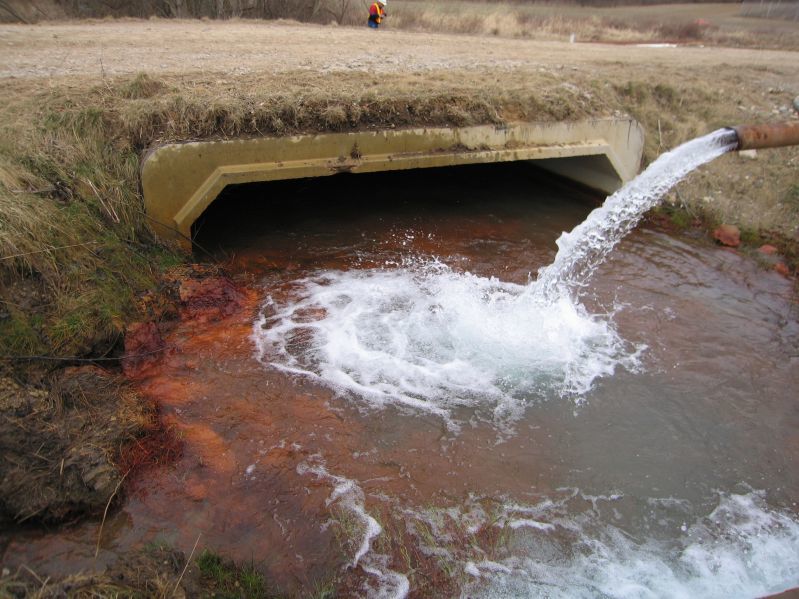
An industrial discharge (end-of-pipe or point source pollution) is relatively easy to monitor for pollutants on site. Point sources of water pollution, along with water removal, are regulated by the Resource Management Act 1991. Any discharge into water or any major take from a natural waterway (including groundwater) can only happen if a resource consent has been approved by the local regional council. The Act requires any user of a resource to maintain the quality of the resource. While industries use water to help them run their business, they must comply with strict conditions. Water that is used on site must be treated before being returned to a waterway.
In-stream water quality testing gathers information on the effects of less-visible, non-point sources of water pollution. These include stormwater and nutrients and sediment from farmland that are washed into waterways by rainfall or seep through the soil into groundwater and can run underground to reach surface waterways.
Nature of science
Professionals who conduct water quality tests follow accepted protocols to ensure standardised measurements across the sectors. Community groups should use the same protocols, where possible, to ensure their data is robust and reliable.
Related content
The article Water quality highlights the importance of a catchment area and how water is treated. Use the article Water quality monitoring to find out what is monitored and why it is measured.
The article Human impact on rivers highlights key areas we influence in river ecosystems.
The level 3 Connected article Testing the waters describes how scientists use the nature of science to investigate freshwater pollution.
Use the article Exploring groundwater and pollution to find out how a year 3 class undertook an inquiry into the Waikato River and water pollution.
Many of these same factors impact on freshwater lakes. The article Lakes380 – what does the data tell us? provides information about the Lakes380 project, the type of data it collects and what the Lakes380 team has learned. This activity helps students interpret the lake data.
Activity ideas
Observing freshwater macroinvertebrates gets students out to their local stream, capturing, observing and developing classification systems based on what they find.
Build simple aquifer models to look at point source and non-point source pollution.
Research the effect of common pollutants on our waterways and hold a mock trial to determine the worst pollutant in the country in Water pollutants on trial.
Acknowledgement
This article has been developed in partnership with the Waikato Regional Council as part of the Rivers and Us resource.


